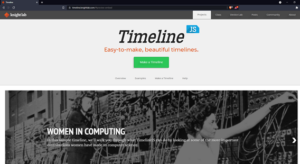
Creating Story Maps and Timelines with free Knight Lab tools
Building Your TimelineJS
Zhi Ming Sim
Introduction
TimelineJS is an important digital humanities tool that helps to visualize relationalities between stories, events and involving actors. Our use of TimelineJS in presenting Evelyn Amony and Grace Acan’s stories aims to trace the milestones of advocacy by Evelyn, Grace, survivors and affected communities of conjugal slavery in conflict. With TimelineJS as a means of presentation, we entrench Evelyn and Grace’s stories into the global community and judiciary efforts towards addressing the needs of conjugal slavery survivors.
Some of the tips given on the TimelineJS site includes 1) Keeping the content short, with not more than 20 slides, 2) to include and position the stories in chronological order and 3) to position the stories towards a major event. This workshop seeks to add onto the tips and guidelines on TimelineJS, how the application is being used in our project working with conflict survivors, the changes we made to fit and document our research and other technological tips we learned along the way as we build the Timeline and the Scalar Project.
Creating Timeline Content
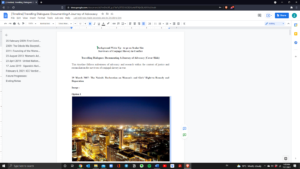
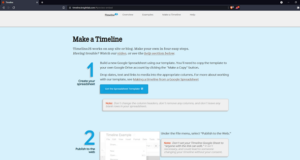
Following the instructions on the TimelineJS site, you will be guided to click onto an excel sheet for the contents to be placed in. However, for easier editing and reviewing of your content, it is best to first collate it through a google document or words document.
While collating the content, there are some key learning and guiding points we picked up. First, we are practice sensitivity surrounding the use of pictures – to not include photographs depicting violent or gruesome images of conflict, images including minors, other conflict survivors and perpetrators. We work closely with Grace and Evelyn, where they look through the pictures they want to include as part of the timeline and all other areas of the Scalar platform.
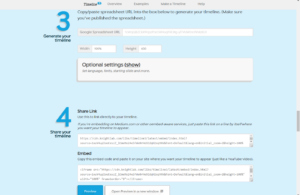
Secondly, because the Scalar platform serves to document community and international efforts supporting survivors – we keep in mind the need to be detailed without misrepresenting the event or stories told. Therefore, our content placed into the Timeline sheet is not short, as recommended. However, the dimensions of the Timeline can be adjusted during the embedding process.
Importantly, we establish a non-linear visualization of advocacy work despite the linear presentation of the TimelineJS application. While events presented in our Timeline are chronological, by centring community-led advocacy milestones within global judiciary and community engagements, we deliver the work of Evelyn and Grace as part of contributing to and intertwining with unfolding international efforts for supporting survivors of conjugal slavery.
We collate our content onto a Google Word document for easier communication and feedback before adding the content into the Excel sheet.
Setting up the Excel Sheet
After finalizing your content and images, head back to the TimelineJS site. Download the Excel sheet. You will need to log into a google email account to gain access to the formatted Excel sheet.
You will need to log into a Google email account to gain access to the formatted Excel sheet. Alternatively, you can create a new Google email for this project.
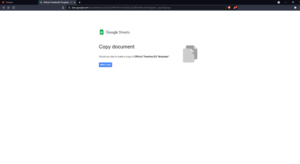
After signing in, you will have access to the Timeline template. Make sure to favorite the document so that it will not be lost within your Google Drive.
Colour Coding
Here, I use a colour palette generator to locate the palette codes that are in line with the CSiW colour theme. There are many free colour palette generators you can find online, I used the one with Canva.
Here is a link: https://www.canva.com/colors/color-palette-generator/
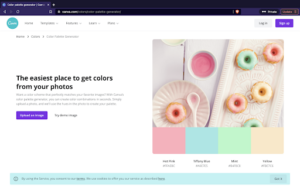
Next, I upload the CSiW banner obtained from the website.
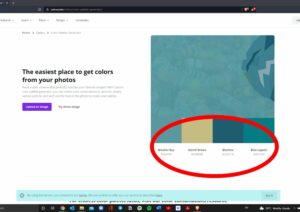
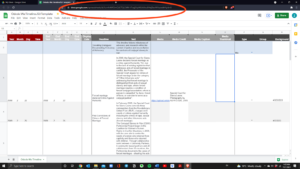
From here, obtain the colour palette codes and insert into the <Background> section of the Excel sheet – onto slides that you want to be coloured.
Adding Images
For adding general images, you can obtain images or pictures from Wikimedia Commons and Unsplash. Images on both sites grant copyright licenses for non-commercial use of the images. It is important to note that even the use of images with creative common licensing for commercial projects will be more complicated than non-commercial projects.
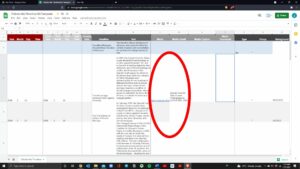
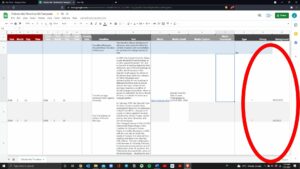
To add your own pictures, upload your pictures into dropbox. Copy and paste the link into the <Media> section on the Excel sheet from your Dropbox image folder. You can add your captions and details of the images on the next column to the right.
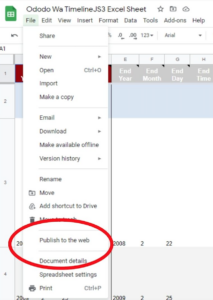
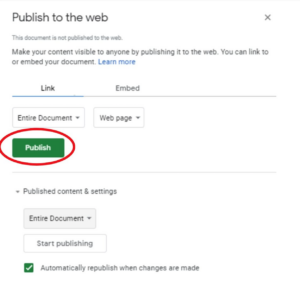
Publish to Web
After you fill up the Excel sheet, you have to publish your Excel sheet on the web. You need to publish the Excel sheet for TimelineJS to read your content. See below for tabs.