
Creating Story Maps and Timelines with free Knight Lab tools
6 Steps: Making a StoryMapJS
Sarah York-Bertram
Introduction
StoryMapJS is a free tool to support online storytelling that highlights the locations of a series of events. It enables you to develop slides for each location in your story.
Requirements
StoryMapJS has its own authoring tool through Google, which is what I used in the development of the Ododo Wa Community Dialogues project. It is possible to use StoryMapJS without a Google account, but editing is a different process. If you prefer not to use a Google account, Knight Lab has information about how to do so in their StoryMap for Technical Users page. However, in this workshop, we use the authoring tool through Google.
StoryMapJS uses JSON data. Complete details on the JSON syntax for StoryMapJS are available on the StoryMap website and here.
Mapping the Journey
From the outset of the Ododo Wa Community Dialogues Scalar project, I suggested a map to track the tour of the Ododo Wa traveling exhibit. After reviewing a range of Scalar projects as well as the third-party applications suggested by the Alliance for Networking Visual Culture, I decided on StoryMapJS.
Content
StoryMapJS supports the development of relationships between images and locations. The platform can use media on Twitter, Flickr, YouTube, Vimeo, Google Maps, Wikimedia, Wikipedia, and more.
We developed collaborative content for our StoryMap. CSiW project coordinator Véronique Bourget, Aaron Coehn of the Canadian Museum for Human Rights, and CSiW project partners, such as Diana Ajok of Refugee Law Project, documented events associated with the Ododo Wa exhibits developing a range of digital media to draw from.
We reviewed photographs, audio recordings, and other media and experimented with them to learn which related best with the tool. After our experimenting, we decided to focus on location to give a sense of place for each spot the exhibit toured. In some cases, such as the Uganda National Museum, the original media we had access to focused on the interior of the building and pictures of people interacting with the exhibit. In those cases, we sought open media files on Wikimedia Commons.
It is recommended that designers keep their StoryMapJS to 20 slides, that users base their StoryMapJS on stories with strong location narratives, and that each event is part of a larger narrative. This can be an excellent way to document something ongoing, such as the Ododo Wa traveling exhibit, but it can also be a new and interesting way of visualizing histories. Also, there is potential to develop videos of your StoryMap through screen recording.
Together with our selected media content and location information, we drew from textual sources to develop place-based captions for each location. For example, we reviewed Gilbert Nuwagira’s Active History post titled Resuscitating Stories: Some reflections on the “Ododo Wa” exhibit and experience on the Ododo Wa launch in Uganda and, with his permission, integrated his statements regarding the National Memory and Peace Documentation Centre’s methods and broader goals on the Kitgum slide. We also drew from collaborative original content we developed with Grace Acan and Evelyn Amony, such as what is featured on the slide discussing the Gulu event.
Making a StoryMapJS in 6 Steps
1. Sign in
2. Create
3. Homepage & Display
4. Media & Text
5. Locations
6. Publish & Share
Step 1
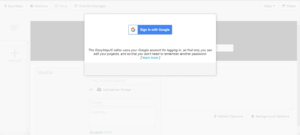
Sign in: Go to https://storymap.knightlab.com/ and click “Make a StoryMap.” Then click “Sign in with Google.”
Step 2
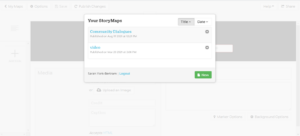
Create: After logging in with your Google account, click “new”.
Then make a title and click “Create”:
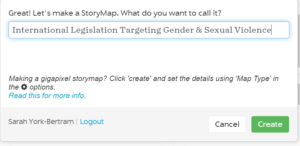
After you click “Create,” you should be directed to the first slide of your StoryMap.
Step 3
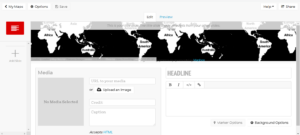
Homepage & Display: This slide is the Homepage of your map and the first page viewers will see. Your entire map will be visible from your Homepage.
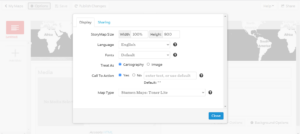
Select your Display preferences. You can do so by clicking the Options button on the left top corner. The Display and Sharing tabs should appear. You can choose the size of your StoryMap, its language, font, whether it is treated as Cartography or Image, the Call to Action, and the Map Type.The Map Type can also be set to custom or a Mapbox with a URL. The visual style of the map can be changed using the presets or through Mapbox where you can create your own style. I used a preset version. There are a lot of customizable options even in the preset versions.
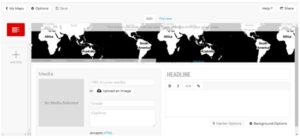
Step 4
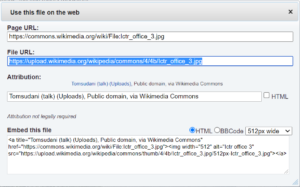
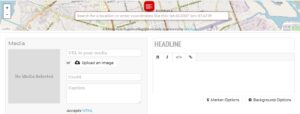
Media & Text: Now that you’ve selected your Display preferences, you can add Media and Text to your Homepage. You can use an URL of an image you’d like to feature here, but if the URL changes or the media is taken down by its owner, it will disappear. To avoid this, you can Upload an Image. For this workshop, we will use URLs from Wikimedia Commons. Wikimedia Commons usually includes Description and Credit information in the media file Summary. Information is also available when you click Use This File.
Now add a caption. You can write your own or use the Description in the Summary. Then add your Headline and the text for your Homepage. You are able to bold and italicize text in the text box as well as edit HTML, add links to the text, and choose the Slide Background. Click Save on the top left corner.
Step 5
Locations: Click + Add Slide on the left-hand side of the page.
This is the first discrete location on your map. In general, the process for this slide is the same as the first. The main differences are that you will add a location and that you can customize your Marker Options. Find the location in the Search for a location box. In some well-charted areas, it is simple to find your desired location by doing a text search for the name or address of the location. For example, the Canadian Museum for Human Rights. In other cases, more research may be involved or a best estimation of latitude and longitude is needed.
Tips for Finding Locations
If you are struggling to find a location in the search box provided by StoryMapJS, there are other ways to find it. Sometimes Google Maps has more charted areas. Right-click a location to find its latitude and longitude. Also, sometimes Wikimedia Commons can help.
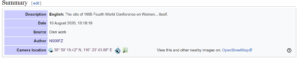
See for example, this link to an image of a Beijing convention center: https://commons.wikimedia.org/wiki/File:Beijing_International_Convention_Center_(20200810181819).jpg
In the image Summary, click the link to the Camera Location.
A GeoHack site with the latitude and longitude will pop up.
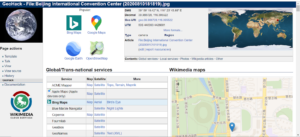
Use the decimal version of the latitude and longitude in the StoryMapJS search box.
Add lat: lon: in front of the numbers. For this example, I would type the coordinates like this: “lat: 39.988728 lon: 116.395522″

.jpg)