
DHSS Assignment Guides
Transcription and Data Visualization
Transcription and Data Visualization as a DHSS Assignment
Featuring work from Robyn Le Lacheur‘s exhibit “Looking Back: Temporal and spatial connections of post-war migration and displacement through the eyes of the Toronto Telegram”
 Though transcription and data visualization are both popular DHSS projects, your students could engage in each task together or separately. With transcription and data visualization, students would transcribe a document and then use data visualization or data analysis tools to demonstrate discursive patterns in the text.
Summary
Description:
- The transcription and visualization of a digitized document
Possible tools/technologies:
- Voyant
- Wordcloud
- Scripto
- WordPress
- Word
Elements of Process:
- Select an item for student(s) to work on
- Create, or get students to create, a mechanism for recording their transcription
- Transcribe document
- Run transcription through a data visualization tool
- Analyze meaning of document through visualization
Size of assignment:
- Small to Medium
Difficulty:
- Easy to Moderate. The size and difficulty level of this assignment depends on the format and length of the original source. A handwritten letter, for example, would be more intensive than a printed newspaper article.
Robyn Le Lacheur did both transcription and data visualization as part of her exhibit “Looking Back: Temporal and spatial connections of Post-War migration and displacement through the eyes of the Toronto Telegram.” However, if framed differently, each task could be enough for one assignment. Robyn did both transcription and data visualization because part of her task was finding the source and making it presentable on a website.
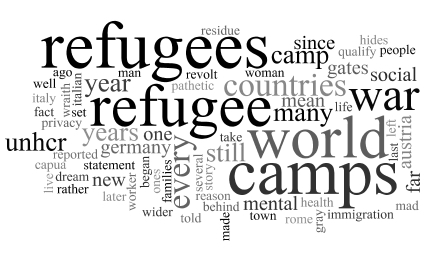
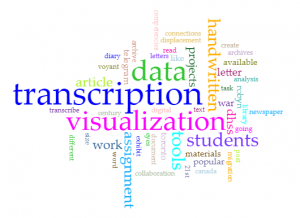
Robyn’s focus for her project was on the images from the Toronto Telegram filed under “refugee.” Working so closely with these images got Robyn interested in seeing how the images were actually used in the newspaper. So, to explore this more closely, she chose one photograph that she found intriguing, did a library search to find the article that used that photograph, and then, with assistance from the Library, she found the article on microfilm. After saving the article in a digital format, Robyn “cleaned” it for “noise” in order to post it on-line. After this work, she then transcribed the article – deciding if she should keep the same line breaks or just type it with standard margins in Word – and put the text through a word cloud generator to identify key words and concepts from the text. Robyn played with different tools for the visualization, including Voyant, an easy and very user friendly data analysis tool, before she settled on WordCloud because she liked how she could customize the words that could be featured.
The result of Robyn’s work is that now Ron Poulton’s 1964 article “Their War Goes On: Opulence Hides Gray Refugees” is available online and situated in a larger exhibit and discussion about post-war migration and displacement through the eyes of the Toronto Telegram.
As mentioned, both transcription and data visualization are popular DHSS activities. A quick internet search can identify resources outside this Guide to support the work of transcription and data visualization. Transcription is a popular DHSS method for history because of the value in transcribing handwritten documents. Data visualization is a popular DHSS method in literature or political science because of the ways in which the tools help identify discursive patterns that may not be as visible by traditional reading.
When framing transcription and data visualization with 21st-century competencies like critical thinking, communication, collaboration, and creativity and innovation, as found by the Ontario government’s international review of 21st-century competencies, each task can be transformed to have your students think about the role they are playing in developing space for greater access to materials and thus the responsibilities they hold when creating, organizing, and/or presenting materials to the public (similar ideas are discussed in the Metadata assignment).
To think about the scale of this assignment for your students, ask yourself organizational questions such as: will students use a document from an already organized and digitized corpus like The Globe and Mail archive, or will they have to find something on their own using microfilm like Robyn did, which will then need to be digitally edited for the web? Will they have to find materials by going to an archive and working with an archivist? Will the original material be typed (like a newspaper article or broadsheet) or will they be handwritten, and if they are handwritten (like a letter), has enough support been given to students to read and understand it? Note: it’s not that young people “don’t know how to read handwriting,” it’s just that handwriting is hard to read. They should be supported in their efforts.
In Dr. Mary Chaktsiris’s course “Digital Humanities: Digital Editing and Publishing” for Wilfrid Laurier University, she got her students to “crowdsource” the transcription of 19th-century handwritten letters by showing the letters in class and inviting students to transcribe each letter together. This activity encouraged both collaboration and discussion about the words in the letter and the context in which they were written. Doing this work as a class also destigmatized any difficulties students may have had in reading the letters on their own.
To support collaborative transcription projects, Library and Archives Canada has provided transcription guidelines for their digitization and transcription projects. These may be good inspiration in your own classroom.
Transcription and Data Visualization suggestions for your students
There are many tools and projects available for transcription and data visualization. Visit our Tools page to explore different options, but find below a few of our favourite tools and projects:
- From the Page: Crowdsourcing manuscript transcription
- Lady Macdonald’s Handwritten Diary: A now-completed project from Library and Archives Canada that transcribed Lady Macdonald’s handwritten diary and made it available online for transcription and tagging
- Scripto: Community transcriptions of document and multimedia files
- Voyant: Data analysis and visualization tools
